


When you’re running several applications, all growing, all evolving, and all built by different teams, keeping observability under control becomes a real challenge. Without clear standards, things can get messy quickly. Are the monitors you have actually doing their job? Are there critical ones missing? And how many monitors are silently aging in the background, no longer useful but still lingering in your setup?
It’s a challenge our small 7-person team faces daily, managing over 3,600 hosts and more than 6,000 monitors.
In this article, we walk through a flow integrating ServiceNow, Terraform, and GitHub Actions that reduced manual monitor creation while maintaining governance and quality.
1. ServiceNow: Request for Monitors
The first step is to get aware of new monitoring needs. Here, we make developers and tech leads accountable for keeping observability healthy. While requests come from them, our team is responsible for maintaining good practices and creating or removing monitors.
For some time, this process was manual. Development teams filled out a form, our team evaluated it, and then we created the necessary monitors. That had been working, but it could be improved.
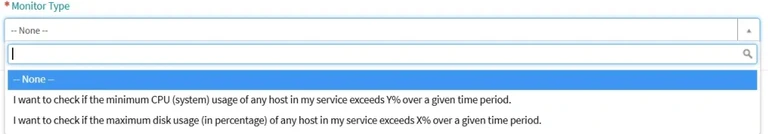
We use ServiceNow to manage and automate our business processes. It allows us to create a form and use it as a trigger to start our automation. For that to work, we need to feed it with high-quality inputs, meaning the form must contain well-tailored fields.
Responsible team and priority. They were good starting points. Since we knew query-alerts **represented 60% of user requests, we began with those, focusing on CPU and disk usage. So the next fields became: service, environment, metric (CPU or disk), thresholds (for warning and critical alerts) and interval for data aggregation.
2. Terraform: A Bridge to Datadog
If Terraform is new to you, the main idea is that it lets you manage resources as “infrastructure as code.” In practical terms, it means that with a single manifest file, you can ask Terraform to create, update, or destroy infrastructure assets, such as containers, serverless functions, or monitors.
There is no need for a deep dive into Terraform, though. It is enough to know we need to declare a resource and its configuration in a .tf file. Datadog already provides the resource for us; we just need to specify how we are going to use it. It is called datadog_monitor, and you can read all configuration options in the Datadog documentation.
Based on that, we created a function called create_monitor like this:
def create_monitor(args):
    monitor_template = '''
    module "{{ module_name }}" {
      source = "../../modules/terraform-datadog-monitors"

      datadog_monitors = {
        {{ monitor_name }} = {
          name                    = "{{ name }}"
          type                    = "{{ monitor_type }}"
          query                   = "{{ query }}"
          env                     = "{{ env }}"
          service                 = "{{ service }}"
          business_service        = "{{ business_service }}"
          group                   = "{{ group }}"
          priority                = "{{ priority }}"
          monitor_tags            = {{ monitor_tags }}
          thresholds = {
            critical = {{ thresholds.critical }}
            {% if thresholds.warning is defined and thresholds.warning is number %}
            warning = {{ thresholds.warning }}
            {% endif %}
          }
          notification_channel    = " {{ channel }} "
        }
      }
    }
    '''
    return rendered_template
However, we still need to replace its variables with the input we receive from ServiceNow. And, of course, apply the manifest.
3. GitHub Actions: The Automation Link
ServiceNow allows us to send a request to GitHub to trigger a predefined workflow. That happens when a request for a monitor is approved by the team’s tech lead. The workflow needs to:
- Create a separate directory where all generated files will be placed. This ensures concurrent drafts don’t affect each other.
- Generate the
main.tffile based onquery-alert.tftemplate, rewriting what is needed accordingly toservice,environment,metric,intervalethresholdsvalues received from ServiceNow. - Run
terraform initandterraform applyin the newly created directory.
We wrote a Python script that performs all three steps, and the GitHub Action executes it. For clarity, here is a simplified example of the workflow we use:
name: Generate Monitor by Service
run-name:
Generate ${{ github.event.client_payload.params.service }} /
${{ github.event.client_payload.params.monitor_name }}

on:
  repository_dispatch:
    types:
      - generate-monitor

concurrency:
  group: main

jobs:
  run-python-script:
    runs-on: ubuntu-latest
    steps:
    - name: Checkout repository
      uses: actions/checkout@v3
      # Clones the current repository to provide access to the codebase

    - name: Create AWS credentials directory
      run:
      # Creates the AWS credentials directory structure if it doesn't exist

    - name: Configure AWS credentials
      run:
      # Creates AWS credentials file using secrets stored in GitHub repository settings
      # This enables the workflow to authenticate with AWS services

    - name: Setup Terraform
      uses: hashicorp/setup-terraform@v2
      with:
        terraform_version: 1.7.3
      # Installs Terraform CLI tool for infrastructure as code management

    - name: Setup terraform keys
      run:
      # Creates Terraform variables file with Datadog API credentials
      # This file is used by Terraform to authenticate with Datadog

    - name: Set up Python environment
      uses: actions/setup-python@v4
      with:
        python-version: '3.x'
      # Installs Python runtime environment

    - name: Install Python dependencies
      run:
      # Installs required Python packages:
      # - jinja2: Template engine for configuration generation
      # - datadog-api-client: Official Datadog API client
      # - requests: HTTP library for API calls

    - name: Set up Git
      run:
      # Configures Git identity for automated commits

    - name: Run main.py
      env:
        # Additional environment variables passed from the triggering event
	      # Sets environment variables including:
	      # - Authentication tokens (GitHub, ServiceNow)
	      # - Monitor configuration parameters from the triggering event

      run:
      # Executes the main Python script with all provided parameters
      # This script typically:
      # 1. Validates input parameters
      # 2. Generates monitor configuration using templates
      # 3. Optionally creates/updates monitors in Datadog
      # 4. Updates ServiceNow tickets if provided
      # 5. Commits configuration changes back to repository
Conclusion
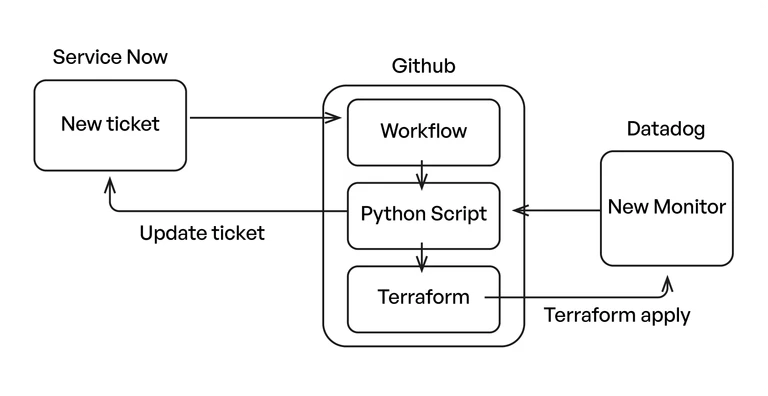
So in the end, our complete workflow comes together like this:
Even though creating a monitor on Datadog is an easy task, a business environment requires following good standards to achieve broad observability at the same it keeps costs under control. With this automation and a smart use of tags, we were able to delegate monitor creation without losing ownership and governance.
Indeed, this solution doesn’t cover every use case, but it still reduced manual ticket creation by 80%, since it handles the most common scenarios. When you’re dealing with more than 3,800 services and 1,800 active users, this kind of setup becomes essential. Smaller teams can usually get by without it.
We still receive requests for very specific monitors, but now they are treated as they should be: exceptions.
What We Gained from Automating Monitor Creation in Datadog
This approach brought several meaningful improvements to the way we manage monitoring:
- Reduction of manual monitor creations
- Good standards are guaranteed across all alerts
- Responsibility is delegated to development teams, with tech leads’ validation
- Tracking of all created monitors and their impact on costs
What We Learned While Automating Our Observability Workflow
Through this project, we learned that automating observability is about building a workflow that teams can trust and adopt easily. These principles made the implementation successful:
- Start with the most common cases: we covered 60% of demands with only two metrics: CPU and disk.
- Leave room for exceptions: some manual creations are still needed, and that’s fine.
- Engage teams from the beginning: we had a great adoption because developers helped design the form.
- Don’t try to automate everything: focus on the 80/20 rule for fast and meaningful results.
Take Your Monitoring Strategy One Step Further
If you’re looking to go beyond automated monitor creation, our team also helps companies build a complete SRE and observability foundation. We support organizations in gaining full visibility across their cloud environments though log centralization, performance dashboards, alerting strategy, and cost optimization,
Our SRE & Observability solution is built on Datadog and designed for teams that want to improve reliability, reduce incident response time, and keep cloud costs under control.