


Discover how we transformed Canal+ existing churn prediction model from a “black box” into a relevant and meaningful solution. Now our client’s marketing teams are able to know why their customers churn and take appropriate actions to retain them.
The existing Canal+ approach could only output the probability of a customer to churn within six months. However, the likelihood of a Canal+ customer to churn was predicted without any concrete reasons or causes. In short, the model was just spitting out a number. This naturally led to a relatively low adoption rate by the international marketing teams.
Context & Key Challenges: From Numbers to Insights
Canal+ Group, a leading French audiovisual media group present in 40 countries and serves more than 22 million subscribers with television channels, the MyCanal streaming platform, and original content production.
Their marketing teams had been using a “fragility score” for some time now—a simple percentage from 0% to 100% indicating how likely a customer was to churn within six months. This score was use to spot an number of customers with a higher risk to leave in order to retain them through specific commercial offers. While the model worked, it left teams with a critical gap: they knew who might leave, but not why.
Therefore, our client was facing three main challenges:
- No explanation for model’s decisions: Marketing teams couldn’t understand why specific customers were flagged as “fragile”
- Low adoption across regions: International entities hesitated to use the score due to concerns about country-specific behavior (i.e., sensitivity to the training data) and lack of transparency
- Limited improvement opportunities: Few indicators and metrics were available to enhance the model or identify weaknesses
The result? Telemarketers were making random retention attempts without clear, relevant arguments to keep customers engaged.
Our client’s goal:
- Deep understanding of their existing model and churn predictions
- Concrete insights about why customers might leave, enabling targeted retention strategies
- Increased trust in the model across international marketing teams through explainability
Our Approach: Churn Prediction Model explainable with Machine Learning Intelligibility (MLI) Implementation
We implemented a comprehensive 8-week Machine Learning Intelligibility solution. With a holistic approach that aims to bring clear and relevant explainability, interpretability, and intelligibility of a Machine Learning (ML) model.
In close collaboration with Canal+ IT and Architecture Teams, we went through these three key phases:
- Model & Data Quality Assessments
- Explainability (XAI) Indicators Implementation
- Operationalization of the explained model
1. Model & data quality assessments
We conducted a thorough evaluation of the ML model’s performance and the training data quality to identify potential biases that could impact predictions (such as geographic location factors).
2. Explainability indicators implementation
Although this model was from the Random Forest Models (a family of models that already possess a form of built-in explainability), it was necessary to determine what indicator would suit best the use case’s context.
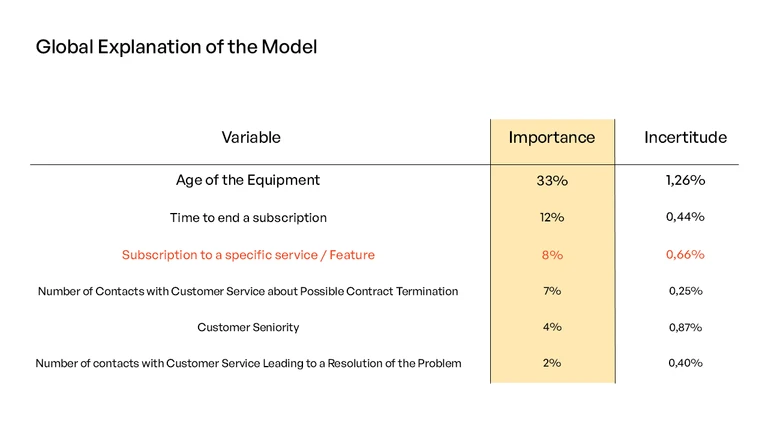
Based on our experience with similar use cases, we chose to use Shapley values for the local explainability, and the PDP & PFI methods for the global explainability. The difference between them is the explanation scope:
A Local Explainability Indicator (Shapley values) explains individual customer predictions—why does John Doe have a 77.4% churn probability? While a Global Explainability Indicator (PDP & PFI methods) reveals overall model behavior—which variables most influence predictions?
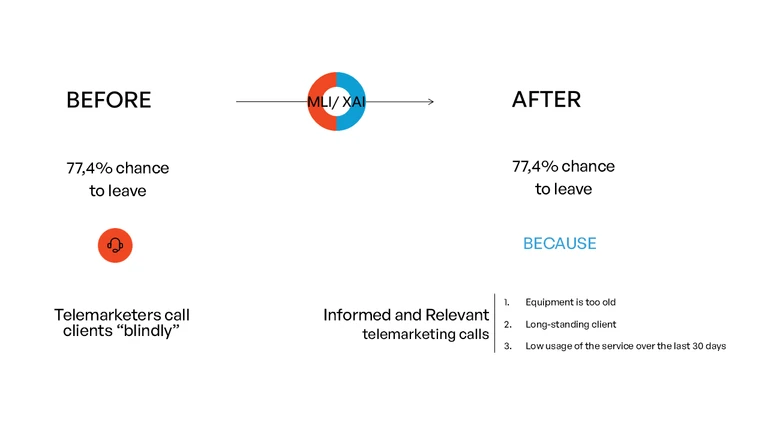
- Before: “John Doe has a 77.4% chance to churn. (No context provided)”.
- After: John Doe has a 77.4% chance to churn because he subscribed long ago and his decoder is likely outdated. (Actionable insight: offer decoder replacement and loyalty rewards).
The telecom marketing department can now create a tailored response to this client such as offering to replace their decoder and a special promotion to reward their loyalty.
3. Operationalization of the Churn Prediction Model
Once the XAI indicators were implemented, it was crucial to make them available to all the business teams, no matter if they were using the churn model directly or not.
Canal+ DevOps and MLOps teams to operationalize our developments into their existing infrastructure. We ensured that all business teams could access the enhanced explanations and ensure we provided a code that fully complies with the technical requirements of the IT infrastructure of our client.
Benefits: Actionable Churn Insights and Improved Model Performance
- 10% improvement in churn prediction performance
- Concrete retention strategies usable by end-user of the model (telemarketers and marketing teams)
- Increased model understanding and trust across international business teams
- Complete explainability of the model through both global and local explanations
- Indicators operationalization into existing MLOps pipelines
Marketing teams can now understand that a customer is “fragile” because they haven’t used the service for 31 days, or their equipment needs updating.
Now, our client is able to see that a customer is ‘fragile’ because they have not used the service for the last 31 days, or because their equipment is too old, for instance—enabling targeted, effective retention campaigns.
Team Involved
The project was successfully delivered through the collaborative efforts of our specialized team over an 8-week engagement. The compact timeline required focused expertise and efficient coordination between our specialists and the client’s team.
- Data Scientist: Our data science specialist brought comprehensive expertise in statistical analysis, data modeling, and machine learning methodologies. They were responsible for designing data-driven solutions, validating model performance, and ensuring the analytical framework met the project’s specific requirements.
- XAI Expert: The Explainable AI specialist played a crucial role in developing transparent and interpretable machine learning solutions. They focused on implementing XAI methodologies, developing explanation mechanisms, and ensuring stakeholders could understand and trust the AI-driven outcomes.
Collaborative Partnership: The 8-week engagement fostered intensive collaboration between our specialized team and the client, ensuring rapid knowledge transfer and efficient project delivery within the compressed timeline.
Technologies Used
The project implementation leveraged a carefully selected technology stack designed for efficient data processing, analysis, and explainable AI capabilities. Each technology was chosen for its specific role in delivering a comprehensive and transparent solution:
- Python served as the primary programming language, providing the foundation for all data science and machine learning development.
- Amazon Redshift was utilized as our cloud-based data warehouse solution, providing scalable and high-performance analytics capabilities.
- Atlassian Bitbucket provided our version control and collaborative development platform, enabling secure code management, peer review processes, and seamless collaboration between team members.