Databricks has been steadily expanding its tech stack to include more and more technologies. While focusing primarily on their Lakehouse features at the beginning, they quickly became a one-stop shop for basically anything to do with data and machine learning (ML).
With their Databricks Apps feature – released in the second half of 2024 – Databricks gave their users another possibility to leverage data and models, by providing an easy way of creating dashboards and data apps completely on Databricks.
TL;DR
- Lakebase consistently outperforms SQL Warehouse in low-latency operations, making it ideal for real-time applications.
- The relative speedup is most pronounced for small batch sizes, while large-scale bulk operations see diminishing returns.
- SQL Warehouse may still be suitable for scenarios where latency is less critical or where specific features outweigh performance considerations.
Solving Real-Time Data App Performance Challenges
Building real-time interactive data apps has traditionally faced a significant shortcoming if performing reads and writes on the data sources frequently. Using the SQL Warehouse to carry out these operations, the latency could be in the order of seconds. Waiting several seconds after entering data in a real-time app can severely impact user experience. One solution would have been to circumvent the SQL warehouse for these updates and make use of a separate database service like a Postgres instance and, consequently, configure resources, connections and authorization on top.
Databricks acknowledged this limitation and so in June 2025 they introduced their new Lakebase feature – a Postgres database instance directly built into Databricks. With Lakebase Databricks commits to alleviating all the previously discussed problems, promising to cut down the latency to just a couple of milliseconds.
Let’s take a close look at Lakebase, focusing primarily on its performance to determine if Databricks’ claims are realistic and what to expect when switching from the SQL warehouse to the new Lakebase.
Our Benchmark Approach
We were particularly interested in the combination of Lakebase and a real-time application.
Test setup
Our team created a new Databricks App to account for any communication overheads that might not be present when testing the performance through other means and, therefore, have a realistic setting. By creating a very basic to-do Databricks App and realistic data with varied types, we ensure to be as close as possible to a practicable application. Each to-do item includes text content, a Boolean indicator whether it is already completed, and a timestamp that signifies the task’s creation time.
Thus, a typical line of data that we insert into, modify and read from our respective databases looks like this:
(1, 'todo: benchmark_task_0001', false, TIMESTAMP '2025-09-04 12:34:56')
Benchmark configuration
Our benchmark aims to test the basic functionality of both connection modes, so we chose to time read, update, and insert operations. Additionally, we explored different data sizes for insertion to examine the scaling behavior of both techniques.
For this purpose, we created two new tables. One in our catalog connected to our Lakebase instance, the other one as a simple Delta Table in Unity Catalog. To ensure comparability between both connection methods we chose the smallest instance for both resources, i.e. a size of one Capacity Unit (CU) for the Lakebase Postgres instance and a 2X-Small SQL warehouse of type Pro. We used the ConnectionPool implementation of psycopg2 to connect to the Lakebase and the Databricks SQL-connector to establish a connection to the SQL Warehouse.
We started each suite run with an empty database and populated it with 10,000 entries to simulate a real-world scenario that would of course not be empty. Thus, each database had the same size as one benchmark run to another. Moreover, before each operation sequence, we performed three warm-up operations of the same type to make sure the system was in a steady state and that possible initialization costs did not distort the measured performance.
Lastly, we repeated every operation 25 times to ensure statistical significance and reduce the impact of outliers, giving us a clearer picture of performance trends across both systems.
Testing Methodology
To ensure a fair and consistent comparison between Databricks Lakebase and SQL Warehouse, we designed a benchmark suite that evaluates the performance of common database operations: select, update, and insert. Each benchmark executes representative SQL statements repeatedly over a controlled dataset, allowing us to observe latency, throughput, and system behavior under load.
SELECT benchmark: Measuring read performance
The select operation in our benchmark looks like this:
SELECT id, task, completed, created_at FROM {table} WHERE id = %s
This query simulates a user retrieving a single to-do by ID. We made sure to always query a different ID for each iteration to avoid any caching to take place that might skew the performance in any way.
UPDATE benchmark: Testing performance of in-place data changes
We measured update performance like this:
UPDATE {table} SET completed = NOT completed WHERE id = %s
This update flips the completed status of a single task. It mimics a transactional scenario where users frequently toggle task status (e.g., marking items done/undone in a task tracker). Similar to the SELECT benchmark, we query a different ID in each iteration to avoid inadvertently measuring caching effects. For the Delta Table in Unity Catalog deletion vectors have been enabled.
INSERT benchmark: Evaluating write performance
This benchmark measures write performance by inserting new tasks into the table using:
INSERT INTO {table} (task, completed, created_at) VALUES (%s, %s, %s)
One subtle but important difference between the systems lies in how primary keys are handled. Postgres can auto-generate the id field, whereas SQL Warehouse (via Databricks) requires explicit ID assignment. To ensure a fair comparison, we did not use Lakebase’s automatic ID generation and manually assigned IDs in both systems, incrementing by one for each inserted row.
Bulk INSERT testing: Realistic ingestion patterns
To assess how each system handles higher ingestion volumes and scales under load, we included a bulk insert benchmark. This test is critical for understanding throughput characteristics, especially in scenarios where large datasets are ingested in batches — such as ETL pipelines or periodic sync jobs.
We constructed multi-row insert statements like:
INSERT INTO {table} (id, task, completed, created_at)

VALUES (val1), (val2), ..., (valn)
For SQL Warehouse, the Python client (databricks.sql) currently does not support executemany. Instead, we batched inserts by manually constructing a single SQL statement with multiple value tuples. Although Postgres supports executemany natively, we opted for the same manual batching approach to ensure 1-to-1 execution logic across both systems. This decision ensured consistent client behavior and allowed us to isolate the performance impact of bulk ingestion more accurately.
Performance Comparison Results: Databricks Lakebase vs. SQL Warehouse
Our benchmarking results highlight the stark performance differences between Lakebase and SQL Warehouse across various database operations. Each operation was repeated ten times, with three warm-up iterations to ensure accuracy.
Single operation latency: Milliseconds vs. seconds
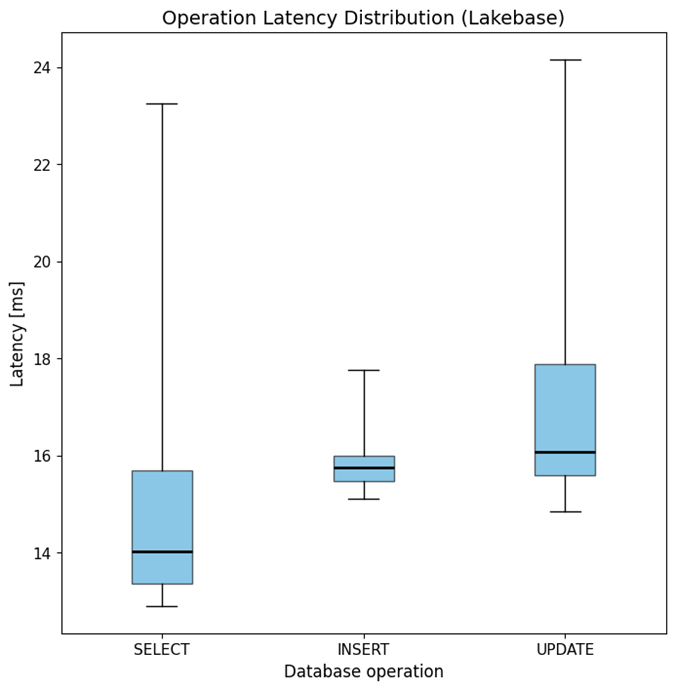
All operations in Lakebase demonstrate remarkably low median latencies, ranging from 14 ms to 16 ms, with minimum latencies in the single digits and maximum latencies in the 25 ms range (see Figure 1). This consistency underscores Lakebase’s efficiency for real-time applications.
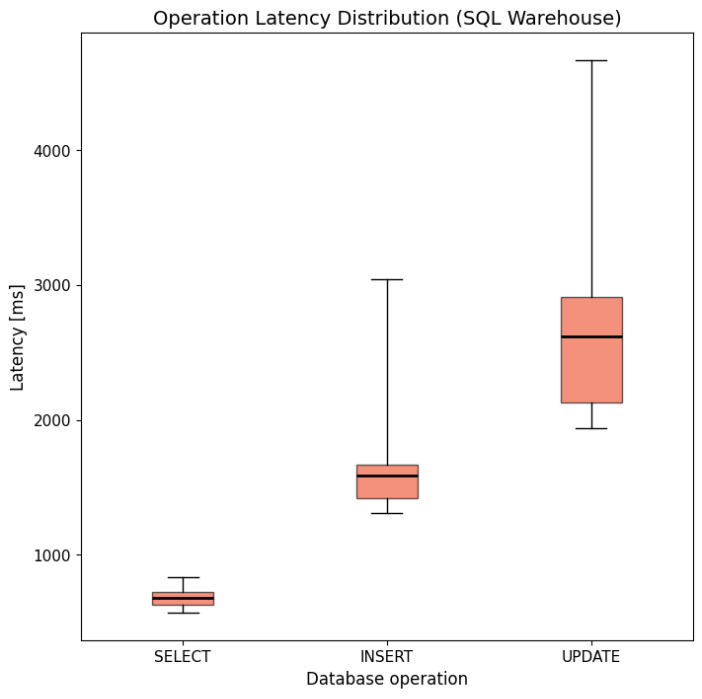
In contrast, SQL Warehouse exhibits significantly higher and more variable latencies. SELECT operations average around 700 ms, while UPDATE operations can take up to 4.5 seconds (see Figure 2). While a 700 ms delay might be tolerable for initial data retrieval in some real-time applications, multi-second wait times for updates are likely unacceptable in most scenarios.
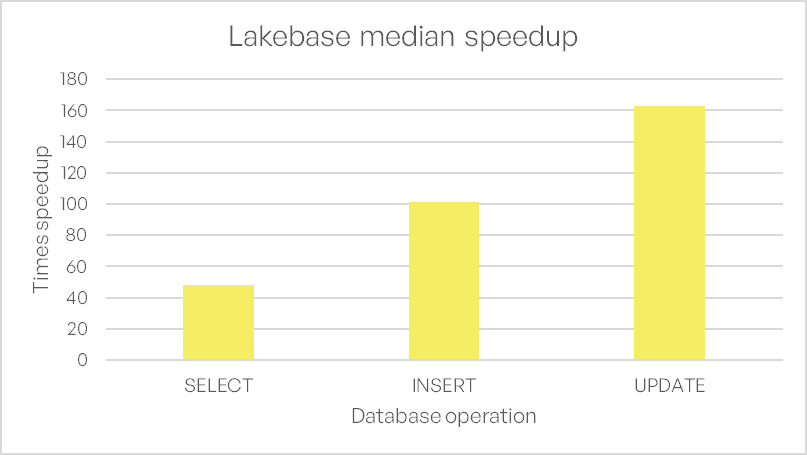
Relative Speedup: Up to 160x performance improvement
Lakebase’s performance advantage is further emphasized when comparing relative speedups. As shown in Figure 3, Lakebase achieves up to 160× faster operations than SQL Warehouse, with the most significant gains observed in UPDATE operations.
Bulk INSERT performance: Scalability aspect
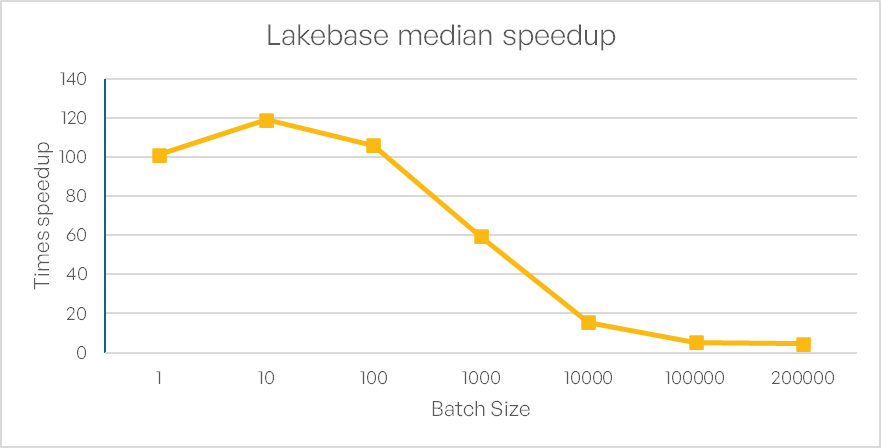
We also evaluated the relative speedup of INSERT operations for varying batch sizes. For small batches (1–100 rows), Lakebase delivers a speedup of 100–120× over SQL Warehouse. However, as batch size increases, the relative performance gain diminishes sharply: dropping to 60× at 1,000 rows, 18× at 10,000 rows, and stabilizing around 4.5× for very large batches (100,000–200,000 rows) (see Figure 4).
This trend suggests that while Lakebase excels in low-latency, small-batch operations, its advantage narrows for large-scale bulk inserts. Additionally, we encountered limitations with the Databricks SQL connector, which failed to execute INSERT statements with more than 200,000 rows. However, a scenario where the insertion of several hundreds of thousands of lines via a real-time data application is needed is probably not very common and such workloads are better suited for the use of different strategies specifically optimized for this, like spark-compute-clusters.
The Bottom Line
Databricks has long been the go-to platform for data and ML, but real-time interactivity remained a challenge—until Lakebase. Previously, SQL Warehouse latencies in the seconds made responsive apps impractical, forcing users to rely on external databases.
Our benchmarks confirm Lakebase’s promise: millisecond-level latencies and up to 160× faster processing times than SQL Warehouse. It removes the need for external databases or workaround solutions, enabling truly real-time data apps—natively on Databricks.